The Start of ICON
Research reveals how much we’d been missing of our connection to space
Earth’s ionosphere is chemically and dynamically complex—energized and stirred up by the aurora at the poles, concentrated and unstable at the equator. ICON focuses on this region because it is the place where coupling between our atmosphere and our space environment really occurs.
Our understanding of this relationship has come from almost a century of measurements, first from the ground and later from space. We know that the ionosphere swells in the daytime as the atmosphere is ionized by solar ultraviolet radiation. The densest region of the ionosphere is found at about 300 km (180 miles) above us. This layer of plasma—known as the F Layer— mostly maintains its density throughout the day and night; the neutral gases are very thin at these altitudes and so recombination happens slowly. Because of this layer, we can bounce radio waves around the planet, particularly at night, when the lower layers of the ionosphere disappear and leave a vast shell of plasma around the planet.
Intriguing as this is, it is the auroral ionosphere—located in space in the regions above the north and south poles – that has usually piqued scientists’ interest. At the poles, the energy of the solar wind is directed by Earth’s magnetic field into the atmosphere in the aurorae, and the ionosphere is the avenue by which most of that energy is transferred from space to Earth. NASA’s IMAGE mission, launched in 2000, performed a revolutionary investigation of this process. IMAGE used a powerful new camera called the Spectrographic Imager (SI) to measure some of the hardest-to-see emissions of the Earth and its space environment, and to measure the ionospheric coupling in the auroral zones.
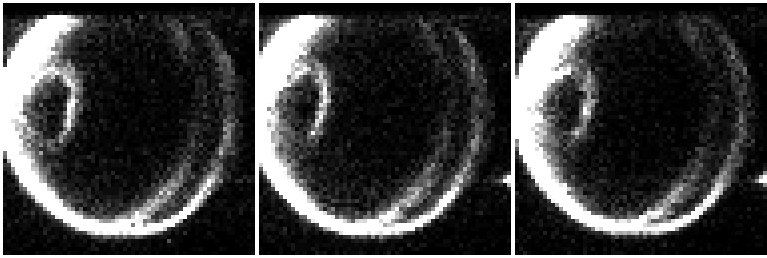
Figure 1. Early images from the IMAGE Spectrographic Imager (SI) of atomic oxygen emissions, at 128x128 resolution, obtained on March 25, 2002 at around 12 UT. Subtle changes to the equatorial airglow bands (on the right of each frame) can be seen on the timescale of minutes, with similar changes to the aurora on the left of each frame.
In the first years of the IMAGE mission, observations of the whole Earth revealed other, unexpected features of our atmosphere. It became clear that the ionosphere over our equator was changing all the time and that it was unexpectedly bright— sometimes as bright as the polar aurora! While these data were coming from IMAGE, NASA launched a second mission—TIMED—to investigate coupling processes in mesosphere and lower thermosphere. Like IMAGE, TIMED also began to see other unexpected features of the space environment. The combined observations of the equatorial ionosphere from both IMAGE and TIMED were unprecedented, and they led to even more surprises!
It turns out that the ionosphere is full of bubbles and structure. These bubbles provided markers (like sticks floating in a stream) for scientists tracking the motion of the plasma, and allowed them to single out regions where the ionosphere was particularly unstable. TIMED provided extremely detailed snapshots of these bubbles on the nightside of the Earth, and IMAGE was then able to track their motion over many hours of time.
A bigger surprise was discovering that the density of the ionosphere depends heavily on longitude. The process that governs the growth of the ionosphere into two major bands of plasma around the equator seemed to depend greatly upon where one is located on the equator. These alternating regions of unexpected enhancements and depletions couldn't be explained using previously accepted theory. Something else was having a significant effect on the ionosphere.
After working together to understand the images and results, scientists from Tokyo and Berkeley [Sagawa et al., 2005; Immel et al., 2006] proposed that the changes were the result of atmospheric tides. Initially, this was only mildly surprising, but when scientist considered the source of the tides, and where the tides were strong compared to what was seen in the ionosphere, then it was clear something completely unexpected was occurring, something that caused the scientists to delve deeper.
Atmospheric tides are similar to their cousins, the ocean tides, except that the measure of their size is not the height of the ocean surface, but the temperature of the air and the direction of the wind. Unlike ocean tides that are energized by the gravitational pull of the sun and moon on our rotating planet, atmospheric tides are energized mainly by the addition of heat, chiefly by their absorption of solar radiation. Another driver is the heat released when water vapor condenses into clouds. Atmospheric tides driven by cloud formation were only recently simulated in models, with the surprising prediction that they would often be as large and important as the solar-driven tides.
The TIMED team had actually anticipated this specific tidal forcing scenario of the atmosphere in their theoretical models in preparation for the mission, and their predictions were in agreement with the tidal forcing theories presented by Sagawa and Immel.
The remarkable realization was that these tides were energized in the troposphere, the layer of atmosphere in which we live and breathe. Never had such a connection been so plainly evident in data. The power of global-scale imaging, combined with key atmospheric modeling capability, highlighted the far-reaching effects of our atmosphere, with conditions being transmitted much further into space than anyone ever expected. Scientists had known that electrical currents from space were pushing down on our atmosphere. But now they were discovering that the atmosphere was pushing back!
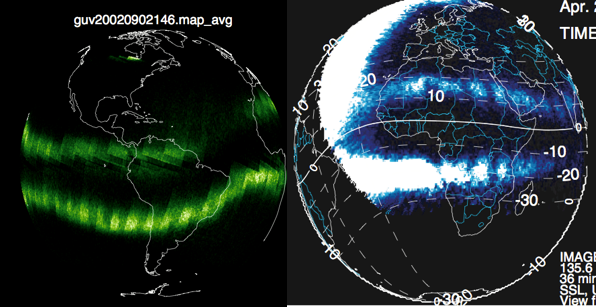
Figure 2. The signature of the equatorial ionosphere at night, seen by the GUVI instrument on NASA-TIMED (left) and the SI instrument on NASA-IMAGE (right).
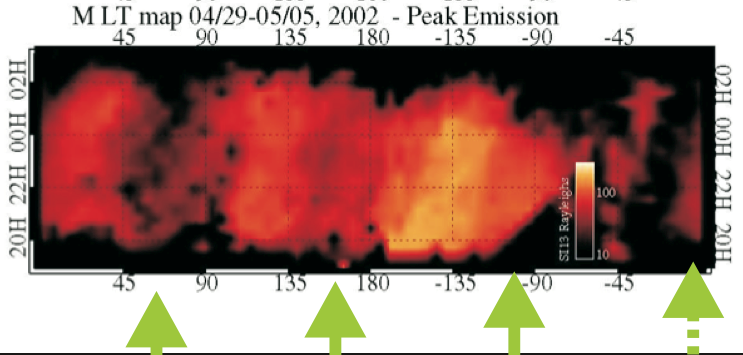
Figure 3. Adapted from Sagawa et al., 2005, A composite 7-day map of the nighttime ionosphere around the planet shows regions of low and high plasma density. These regions occur more frequently than thought possible.
5908